
March Madness and Advertising: A True Cinderella Story?
With March Madness 2025 right around the corner, we attempt to answer the question on every sports fan’s mind:
Is March Madness advertising actually effective?
Wait, what makes advertising “effective”?
Ah yes, the billion-dollar question. Reminds me of the old joke that I just made up:
Q: How many marketers did it take to change the light bulb?
A: Ten, but each tried to take full credit for it.
The truth is: the impact of advertising is murky.
Sure, sometimes it’s clear-cut: you show someone an ad, they click on it, they immediately complete the desired action. Great, that ad was a success.
The only problem? No one actually clicks on ads. (Except for Search ads, fine).
If no one clicks on ads, how do we assess that the ad dollars were a worthwhile investment?
This is where you will get a wiiiiide variety of answers from the industry.
If you are McDonald’s, and you spent $398 million on advertising in 2022, you probably want to know if you should increase or decrease that ad spend in 2023.
So, the McDonald’s marketing team will look at a combination of metrics, from ROAS (return-on-ad-spend) to site traffic stats to share of voice.
Since we don’t work at McDonald’s, we don’t have their internally-tracked statistics to assess their advertising effectiveness.
But one thing we do have: branded search traffic data.
What is branded search traffic?
Branded search traffic refers to the traffic that a website receives from users who search for the brand’s name or variations of it in search engines.
If a brand is receiving a high volume of branded search traffic, it is an indication that people are aware of the brand and are interested in learning more about it.
If more users are searching for “McDonald’s” this year vs. last year, it suggests that McDonald’s brand awareness has increased.
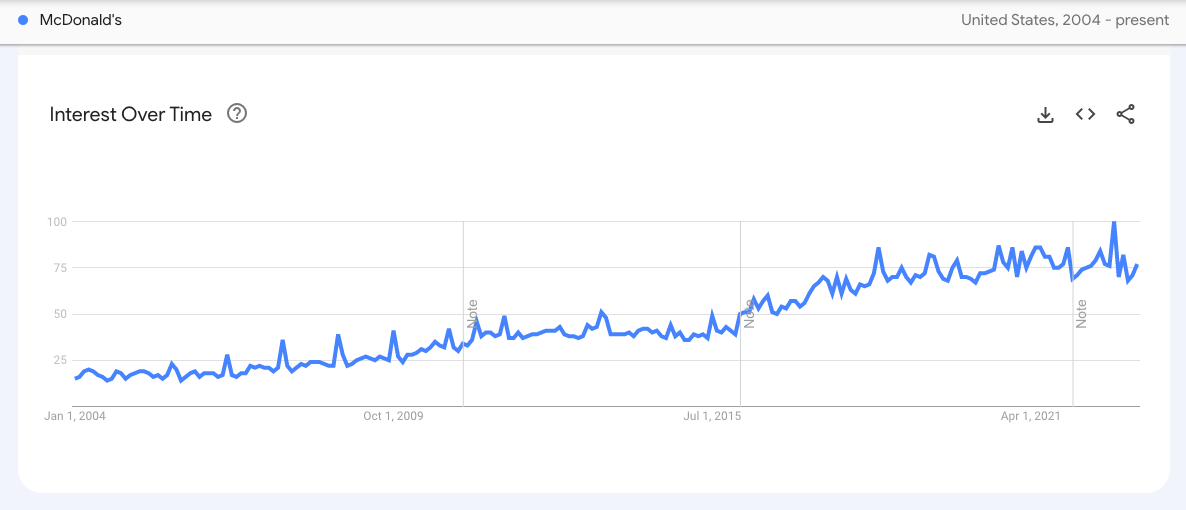
One limitation though: Branded search traffic analysis won’t tell us why.
Why did McDonald’s brand awareness increase through 2019? Why has it plateaued since then?
However – if we can pair an increase in search volume for the brand with a large-scale advertising effort, such as a national March Madness ad campaign, then we might infer the ad campaign contributed to the gains.
Let’s take a look at some examples (finally!)
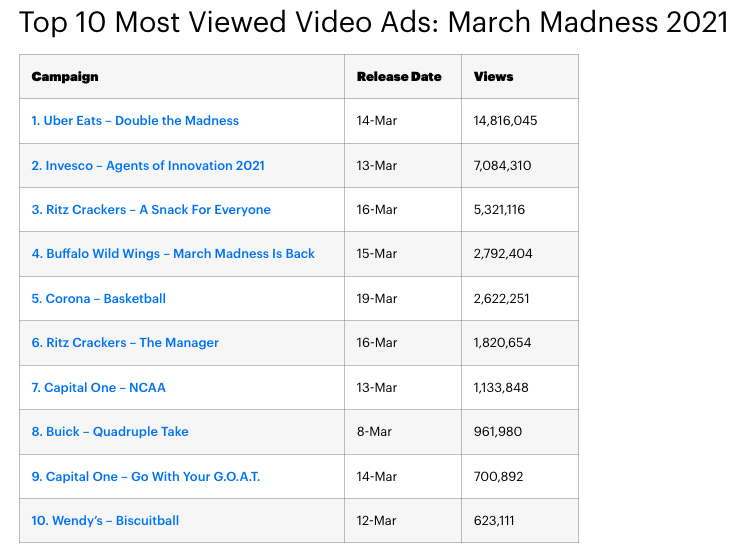
1. Uber Eats
Uber Eats offers us an interesting example, especially since March Madness was canceled in 2020 due to Covid.
When March Madness returned in 2021, Uber Eats took the top spot as the most-viewed video ad of the tournament.
(Or in March Madness terms, you could say Uber Eats “cut down the nets” with their ad spend).
What were the results?
Let’s compare Uber Eats to their closest competitor in terms of market share, Grubhub.
The below screenshot from Google Trends shows us the “interest over time” of people searching for the term “uber eats” vs. the term “grubhub.”
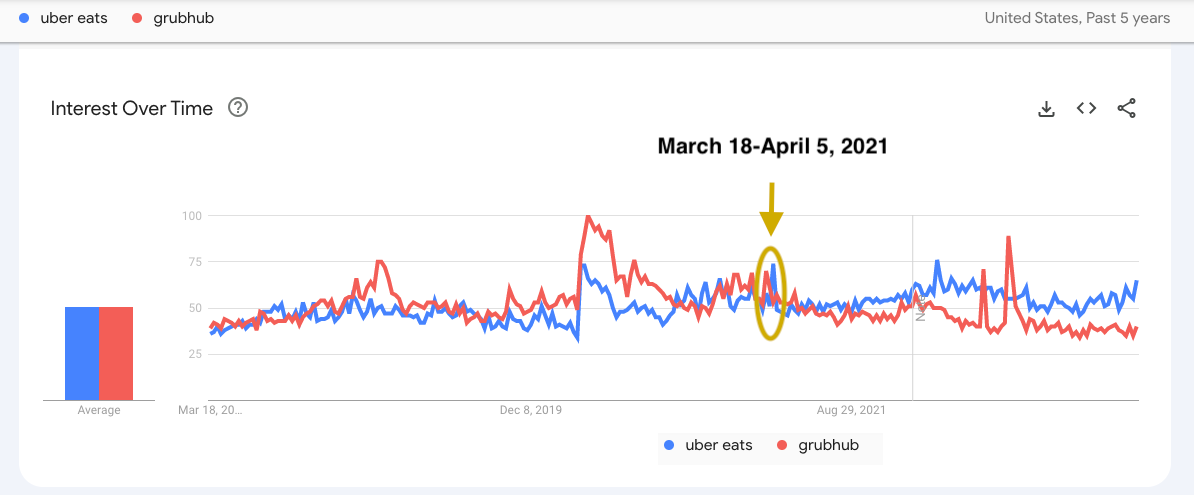
We can see that from 2018 through early 2021, Uber Eats and Grubhub were neck and neck.
Then came the three-week-long March Madness tournament from March 18 through April 5, 2021.
Right after this, Uber Eats branded search interest overtook Grubhub’s, and never looked back.

Was this due solely to their March Madness ad campaign?
We don’t know. There could have easily been other contributors: better operational execution by Uber Eats, other ad buys, word-of-mouth effects, etc.
But the timing sure lines up.
2. Invesco
Invesco marks another interesting case.
As an investment management company, they aren’t the typical household name you might expect to find on the national stage of live sports advertising.
But they went for it in 2021, debuting as the second most-viewed video ad of March Madness 2021.
And the impact was immediate.
On the Monday after the first weekend of the tournament, Invesco’s flagship product (the QQQ Trust Series 1 ETF) realized its largest one-day inflow since the dotcom bubble of 2000 ($4.9 billion).
Interestingly, this didn’t show up immediately in the branded search data.
Below, we compare Invesco to one of their closest competitors, Ameriprise. The chart is divided into three time periods:
- March 2020-March 2021: No March Madness advertising
- March 2021-March 2022: Invesco’s first March Madness ad campaign, and the 12 months that followed
- March 2022-March 2023: Invesco’s second March Madness ad campaign, increasing their total number of video ad impressions by almost 50%.
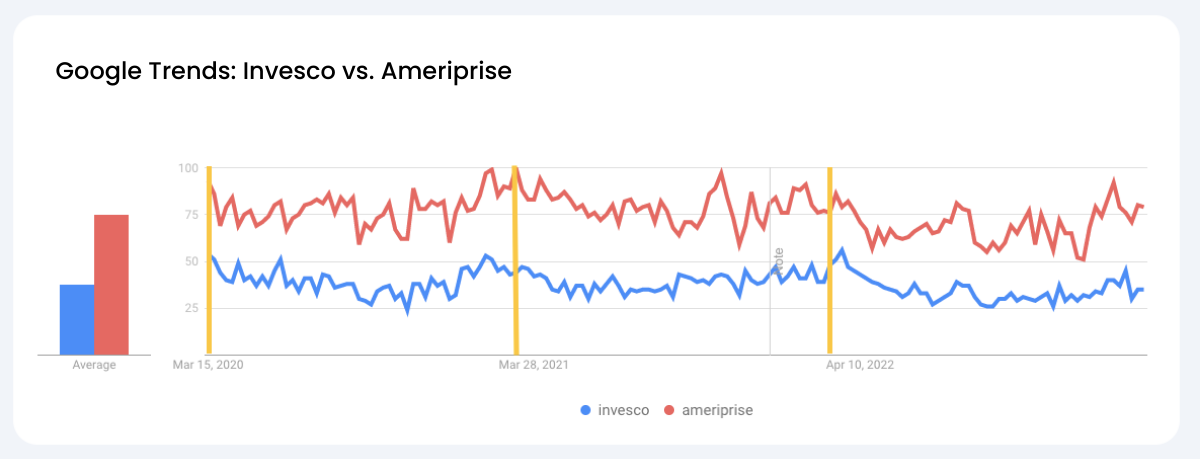
Ameriprise (in red) starts out with a noticeable lead on Invesco in March of 2020. The average gap between the two during period 1 is 38.0.
Invesco’s first March Madness campaign then marks the start of period 2.
The average gap between Ameriprise and Invesco during these 12 months is 38.5, nearly flat from period 1.
So Invesco runs this huge ad campaign, yet doesn’t make up any ground. What gives?
Let’s zoom in on period 3.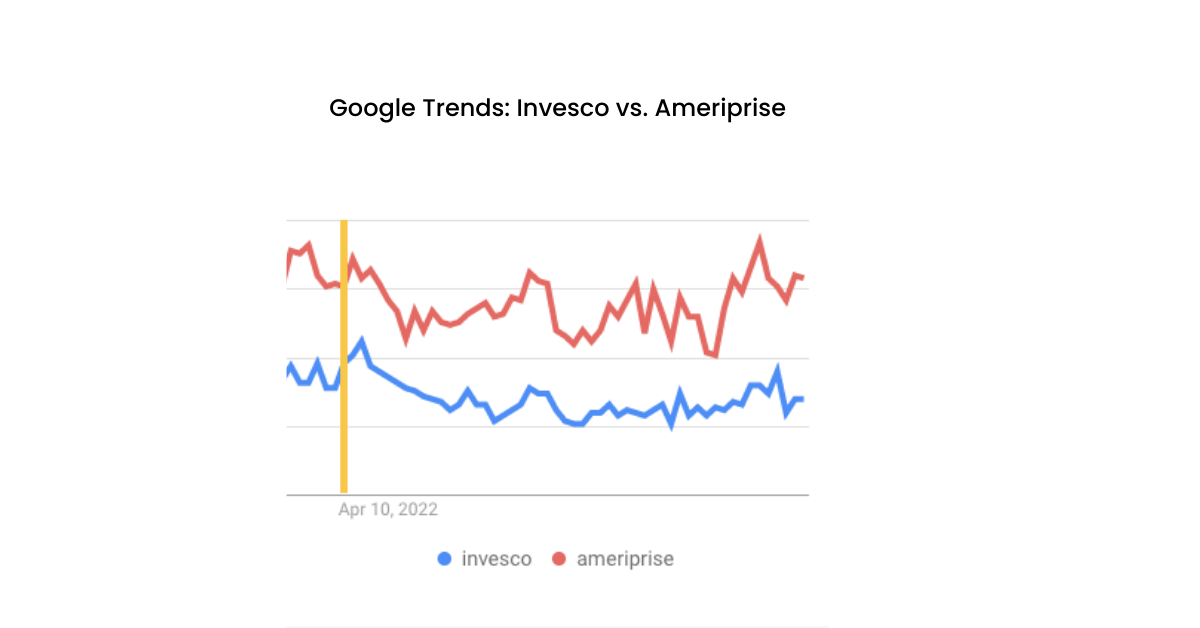
The average gap in the third period though has closed to 33.5. Invesco is finally gaining ground on Ameriprise.
Again, we won’t have the clear-cut answer we so crave, but we can pose some theories.
Perhaps, with Invesco being a financial product, it takes some time to build trust and establish that brand name.
There were also macro factors at play with the state of the economy in mid-2021. But comparing Invesco to a competitor somewhat mitigates this.
Or, what may be music to some of your ears: ad creative can make a difference too.
Matter of opinion, but I’ll call that 2022 ad a nice step up from their 2021 version.
3. Capital One
It would be silly to take a look at March Madness advertising and NOT include one of the big dogs.
For March Madness advertising packages, the NCAA offers a unique two-tiered format: an exclusive top tier called Corporate Champions and a second tier called Corporate Partners.
As of 2023, we’ve had the same three Champions for the last 13 seasons:
- AT&T (since 2001!)
- Coca-Cola (since 2002!), and
- Capital One (since 2010)
These long-term renewals must suggest the brands have liked what they’ve seen, right?
What exactly is included in the Corporate Champions tier?
Plenty of ads, of course. If you watch any of the game coverage, either via traditional TV or streaming, you will find no shortage of ads from those three.
Beyond ads, the Champions get a whole host of sponsorship and native executions, ranging from branded halftime shows to in-game signage and more.
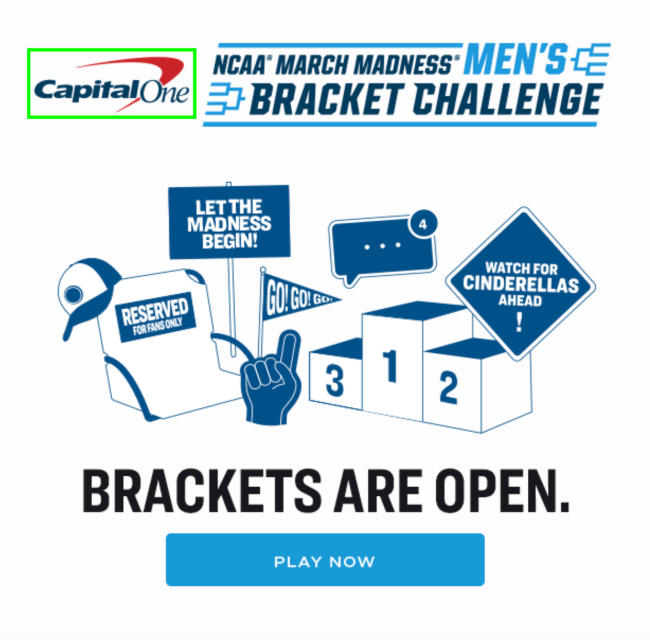
Some of Capital One’s perks include being the official sponsor of March Madness Fan Fest and the March Madness Music Festival the weekend of the men’s Final Four in Houston.
Oh, and also some prominent branding on these little things known as “brackets”:
Ok, but is being a Corporate Champion worth it?
Since Capital One has been a Champion since 2010, let’s take the long view, shall we?
Below, we compare branded searches for “Capital One” vs. those for “Chase.”
Note that Chase has a nice lead when the chart starts in 2004, and then balloons to a gigantic lead by 2010: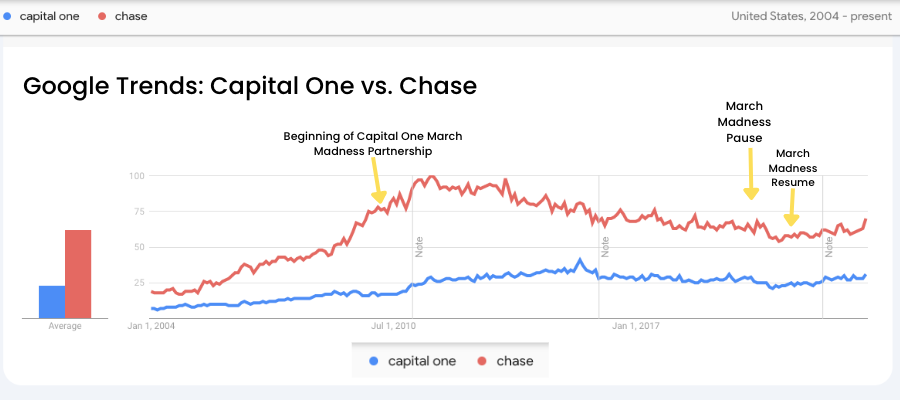
The first yellow arrow marks when Capital One begins their Corporate Champion sponsorship of March Madness.
You will see that in the months that follow, Chase actually continues to grow its lead.
But… when does that lead peak? March 2011.
Maybe Capital One’s creative got better, maybe their sponsorship executions were more impactful.
Or maybe it just takes the right amount of frequency and consistency to begin to establish trust in your brand.
This chart simplifies it to show Chase’s dwindling lead over time: 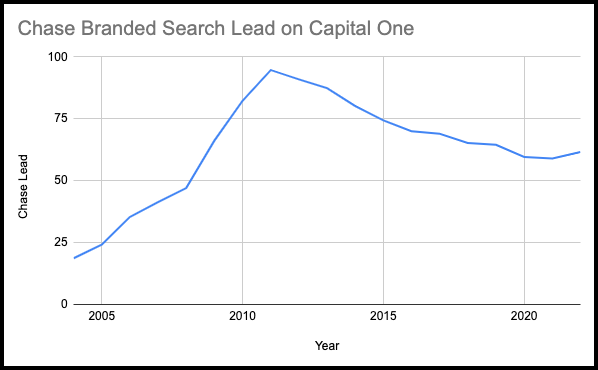
Consistent progress by Capital One until we see a little blip when 2021 hits, showing a slight uptick.
Why 2021?
Well, recall that March Madness was canceled in 2020. It’s noteworthy that Capital One still gained ground the year they didn’t have their splash partnership in place, yet lost ground exactly a year later.
So, to review:
- Chase had a huge lead on Capital One
- Capital One started their March Madness ad blitz in March of 2010
- Capital One didn’t show initial impact from this buy
- But exactly one year later, Capital One started closing the gap
- Capital One didn’t run March Madness ads in 2020
- Exactly one year later, Capital One started losing ground to Chase
Maybe there are some long-term effects and lags in brand advertising that we still don’t account for that well today?
And for one final way to look at Capital One over the years:
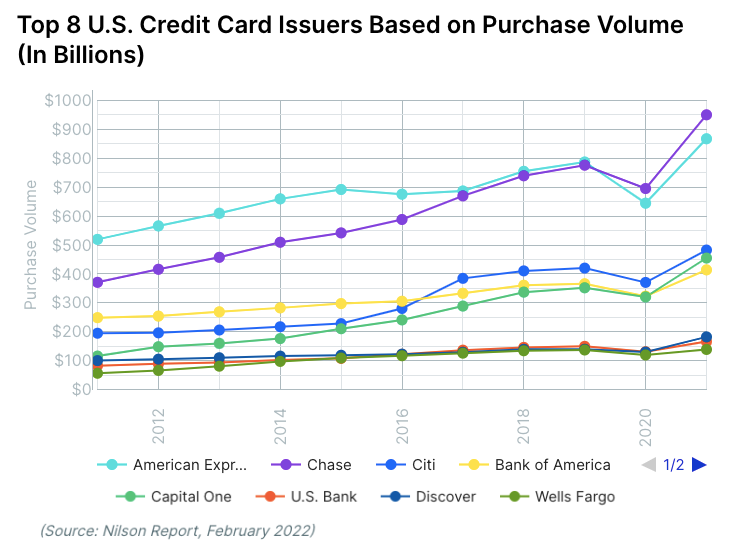
In terms of purchase volume, in 2011, Capital One was right there with U.S. Bank, Discover, and Wells Fargo.
Since 2011, Capital One has dusted those three, overcome a sizeable gap to pass Bank of America, and is now on Citi’s heels. Next up: American Express and Chase.
Conclusion
Branded search data offers us a window into a company’s brand awareness and how their advertising efforts may be impacting the brand.
What are your thoughts on branded search data as a measure of long-term advertising success? Let us know in the comments.
Or, let us know if you have any leads on this year’s Cinderella bracket pick.
